OUR PRODUCTS

Zero troubleshooting time.
Instant Root Cause Analysis.

Root Cause Analyzer
Automates dump capturing, analysis & instant RCA report generation.

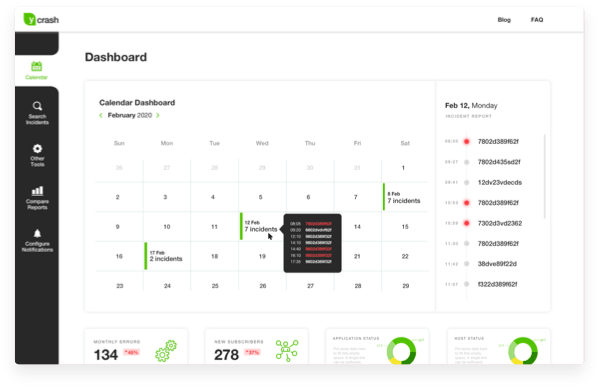
yCrash captures thread dumps, heap dumps, GC logs and several more artifacts, right when the problem is happening in production. It analyzes those artifacts & generates a root cause analysis report in the dashboard instantly.

fastThread

Java Thread Dump Analyzer
Troubleshoot JVM Crashes, slowdowns, memory leaks, freezes, CPU Spikes.

World-Class thread dump analyzer to fire flight any sort of JVM related availability, scalability and performance problems. Applies several Intelligence patterns discover the root cause of the problem instantly.

GCeasy

Universal GC Log Analyzer
Industry's first Machine Learning guided Garbage Collection Log analysis tool.

Universal Garbage Collection Log Analyzer that parses any format of Garbage collection logs and generates WOW graphs & AHA metrics. Inbuilt intelligence has the ability to discover any sort of memory problems.

HeapHero

Java Heap Dump Analyzer
World's first memory dump analysis tool to find out the amout of memory wasted.

Heap Hero will parse and analyze heaps dumps written in any language that runs on the JVM. It will convert Java, Scala, Jython, JRuby heap dumps to useful information to optimize your memory usage.

OUR FEATURES

Dramatically improve application performance.

Drastically reduce troubleshooting time.

OUR TRAINING

World Class Java Performance
Engineering Training

Our easy to understand, fun filled training programs is a preferred choice for several enterprises to transform
their engineers into performance experts. This program includes:
  • ‘Ah ha’ moments provoking presentations
  • Hands-on lab exercises
  • Troubleshooting real-world problems
  • Best Practice recommendations
350,000
DEVOPS ENGINEERS
10,000
DUMPS/DAY
5000
HAPPY ENTERPRISES
200
SUCCESSFUL TRAININGS
OUR TESTIMONIALS

What do engineers say about our products?

Thank you very much! Your report was very usefull and helpful. It contains many illustrations and graphs. This report had attracted my attention to a problem I missed during manual parsing the thread dump. Thanks again!

J.VASILTSOV,
CFT
This is a great example of elegant programming, please keep it good! I'm happy to continue loading reports to get a fast "looks good or needs attention" answer. And in doing so, whenever I visit gceasy.io, I always relay the link to users with GC issues to look for themselves.
ASHLEY.HALE,
Forgerock
Clean, clear and precise. Memory leak debugging has never been more fun.


HUNG.DAU,
MServices